
INSIDE HEALTH SAVINGS ACCOUNTS
Saving for healthcare expenses is becoming a priority for more Americans.
Health savings across generations
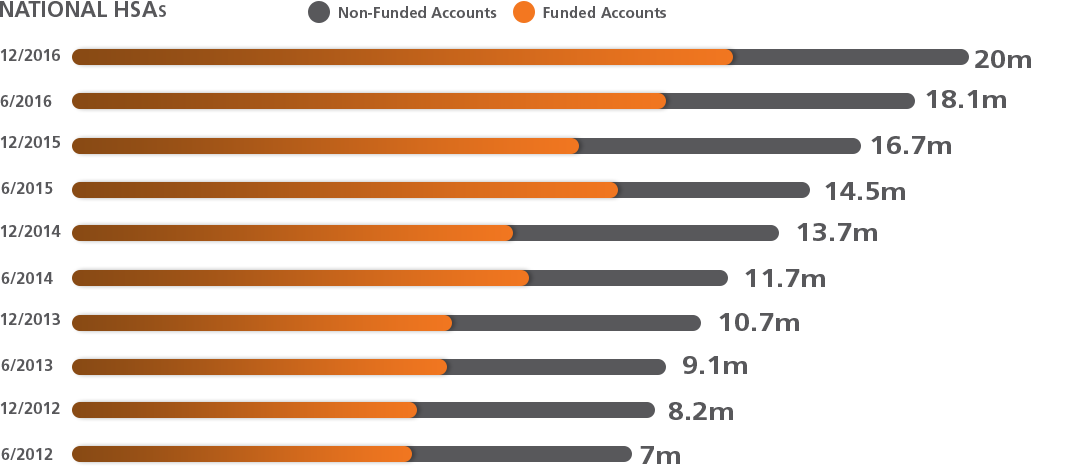
The HSA market really boomed in 2016, with a 20% increase over 2015 in the number of accounts opened. Average HSA balances for the three oldest generations increased significantly year over year. These savers are more likely to be capitalizing on the carryover potential of health savings dollars from one year to the next.
Millennials (up to age 34) have the lowest HSA balances as they have likely just entered the HSA market via an employer's high deductible health plan plus HSA benefits package.
-
<25$755
-
25-34$1,042
-
35-44$1,430
-
45-54$1,968
-
55-64$3,228
-
>65$3,618
Covering healthcare costs in retirement
Most of us know that healthcare expenses continue to rise exponentially. But many Americans don't realize how much they’ll really need to cover their healthcare expenses in retirement and as they continue to age. For a 90% chance of having enough, retirees would need to have the following amounts saved:

$
127
,000
needed by a man at age 65

$
143
,000
needed by a woman at age 65

$
349
,000
needed by a married couple at age 65
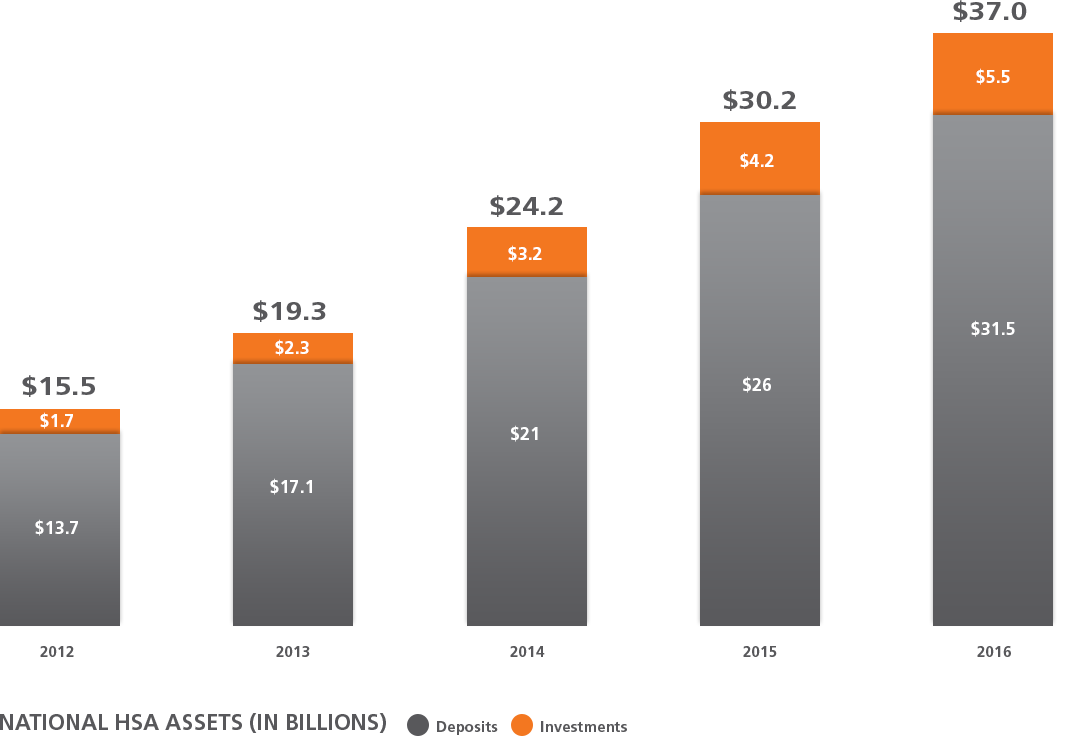
HSA market assets reach record high
HSAs hold almost $37 billion in assets, representing a year-over-year increase of 22% for the period of December 31, 2015 to December 31, 2016.
Projected future growth is even more promising. Our partner Devenir currently predicts that by the end of 2018, the HSA market will exceed $50 billion in assets.
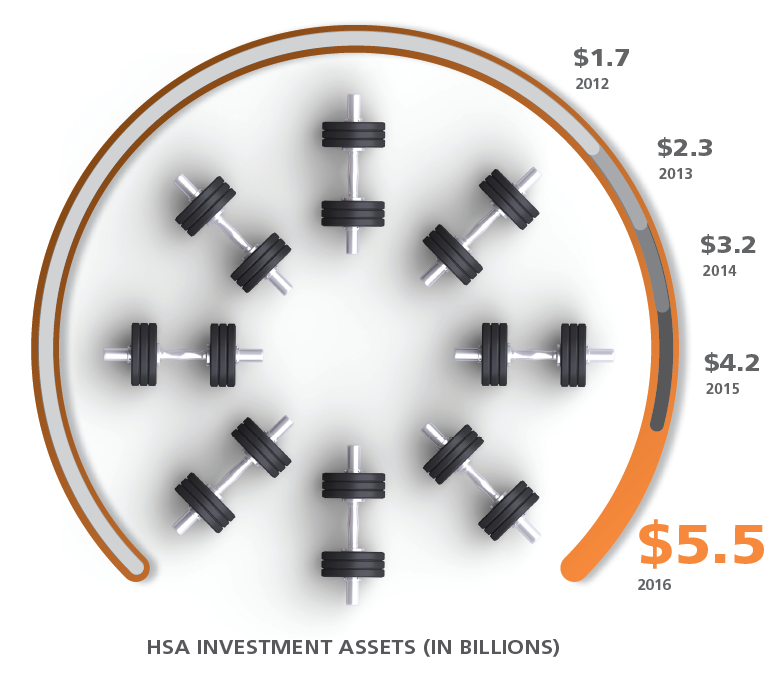
HSA investments see continued growth
Most Americans don’t realize that investment-based HSAs are available. HSA investment assets reached an estimated $5.5 billion in December 2016, up 29% over 2015. And 15% of all assets within the HSA market were in investments as of 2016 year end.
$
14
,
971
Average HSA balance for an investment account holder in 2016
7X
larger than a non-investment holder's average account balance
Savers capitalizing on carryover potential
Unlike healthcare flexible spending accounts, which have a maximum year-to-year carryover of $500, HSAs have no limit on carryovers or fund usage. Savers can continue to build their HSA balances from year to year with dollars that weren’t spent. In 2016 alone, HSA holders carried over nearly $6 billion in savings.
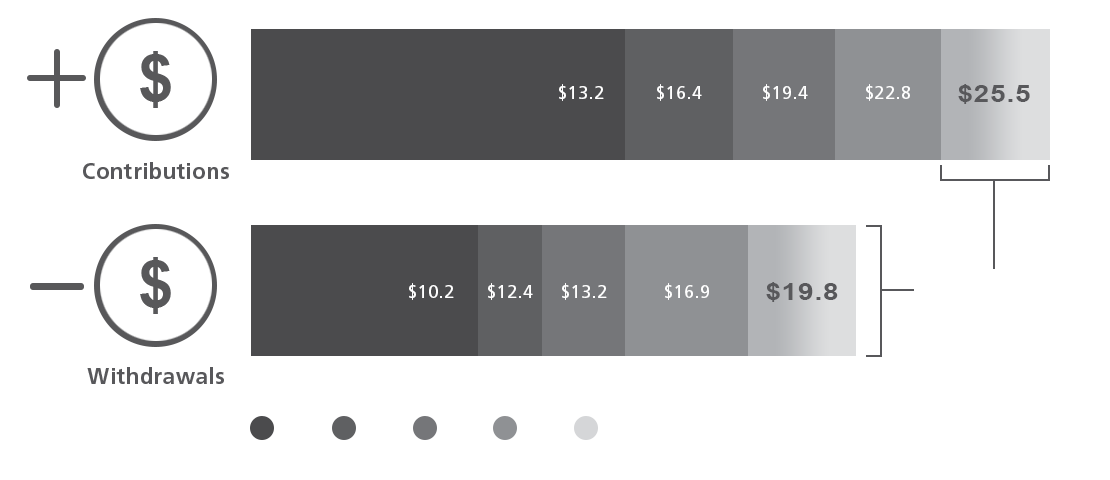
INDUSTRY CONTRIBUTIONS AND WITHDRAWALS (IN BILLIONS)
Employers pitching in to boost savings
High deductible healthcare plans (HDHPs) continue to be a key driver in the growth of the HSA market.
Employers offering HSAs in conjunction with HDHPs accounted for over one quarter of all dollars contributed to HSAs in 2016. As healthcare reform continues to be a hot topic in Washington, HSAs are becoming an area of focus for both legislators and American consumers.
Employers contributed an average of $868 per employee to HSAs in 2016 to help their employees build a foundation of health savings for the future.

37
%
of HSA growth attributed to HDHPs in 2016
26
%
of all HSA dollars contributed to an account came from an employer
$
868
the average employer contribution per employee in 2016
Individuals making steady health savings progress
Employees are matching their employers' increased savings efforts, having contributed an average of nearly $1,800 to HSAs in 2016. Individuals who have taken the initiative to open HSAs not associated with their employer's health plan are also making impressive progress. These savers contributed an average of over $1,700 to HSAs in 2016 and accounted for nearly 20% of all dollars contributed as of 2016 year end.

46
%
of all HSA dollars contributed to an account came from an employee
$
1
,
786
The average employee contribution in 2016 (for those making contributions)

19
%
of all HSA dollars contributed to an account came from an individual account not associated with an employer
$
1
,
713
the average individual contribution in 2016
An even brighter future for HSAs
The HSA market is expected to see sustained growth over the next several years as more individuals begin to recognize the tax-advantage and carryover potential of HSAs. The investment-based HSA continues to gain momentum as account owners look to grow their savings more aggressively over time. Ultimately, pressures from the healthcare and prescription markets will continue to bring HSAs to the forefront of the savings plan industry.
$
8
.
8
billion projected HSA investment assets by 2018
20
%
projected HSA industry growth in 2017